Demand curve displays a graphical representation of demand schedule. It can be created by plotting price and quantity demanded on a graph. In demand curve, the price is represented on Y-axis, while the quantity demanded is represented on X-axis on graph.
Definition of Demand Curve by R.G Lipsey:
“The curve which shows the relationship between the price of a commodity and the amount of that commodity the consumer wishes to purchase is called Demand Curve.â€
Demand curve can further have divided into two types, i.e. individual demand curve and market demand curve.
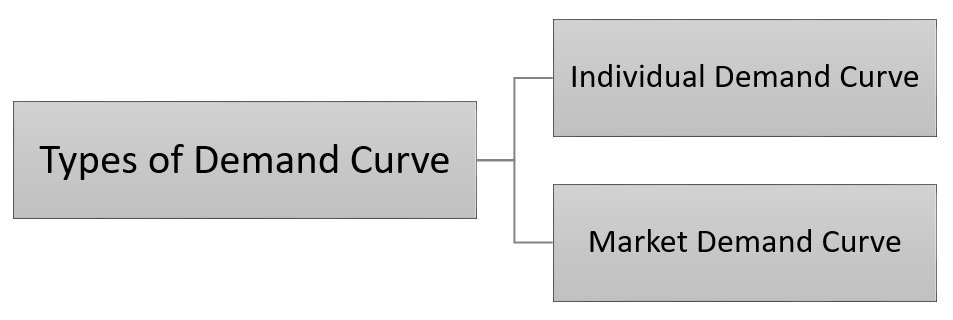
Individual demand curve
The graphical representation of individual demand schedule is called individual demand curve.
While,
Market demand curve
The graphical representation of market demand schedule is called market demand curve.
Below figure displays the individual demand curve for the individual demand schedule:
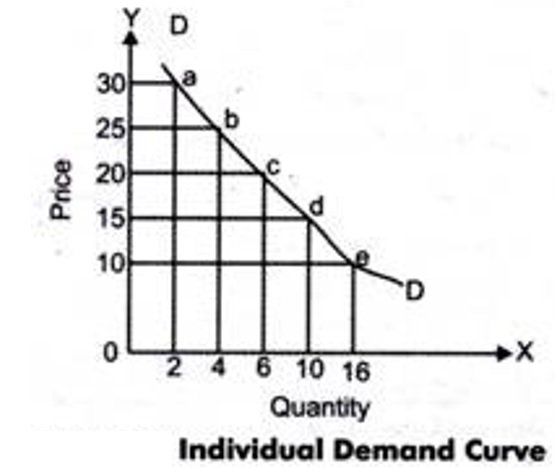
In Figure-3 points a, b, c, d, and e proves the relationship between price and quantity demanded at various price levels. By linking these points, we have got a curve, DD, which is named as the individual demand curve. The slope of an individual demand curve is downward from left to right that shows the inverse relationship of demand with price.
Example of Individual Demand Curve:
Example: Lone Inc. produces product X, whose individual demand schedule is shown in this table.
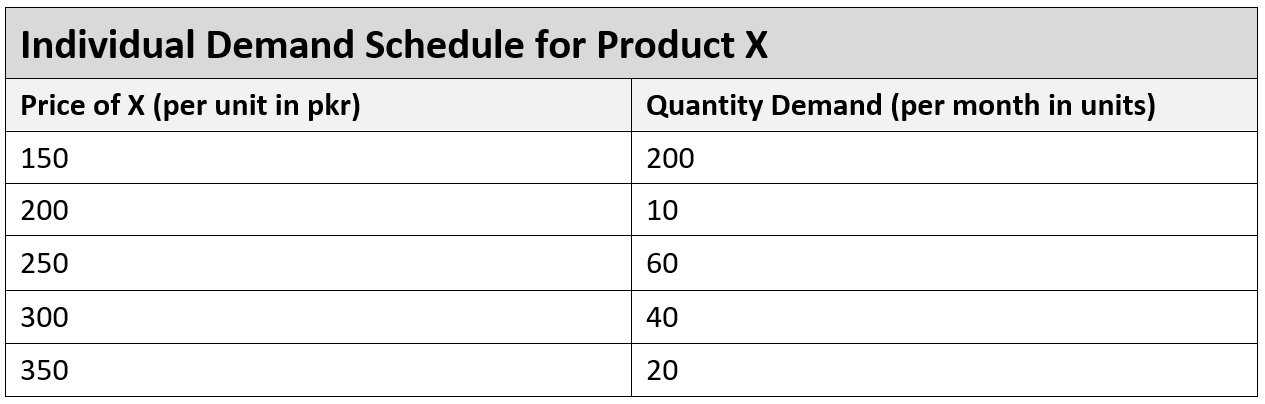
Requirement: Make a demand curve for the individual demand schedule of product X.
Solution:
The individual demand curve for the demand schedule of X represented in above table is shown in below figure.
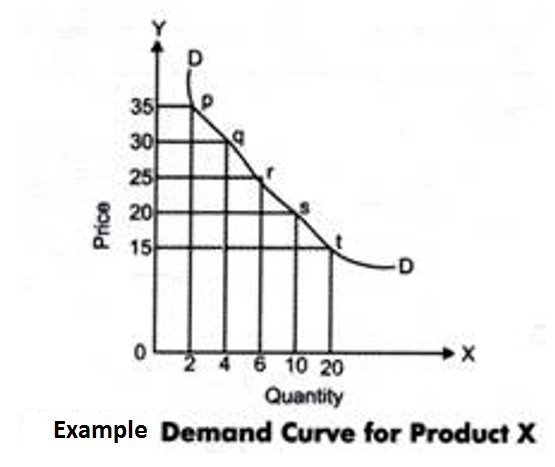
Market demand curve can be found by adding market demand schedules. Below figure shows the market demand curve for the individual demand schedules represented in above table.
In this, the DD curve represents the individual demand curve of product X.
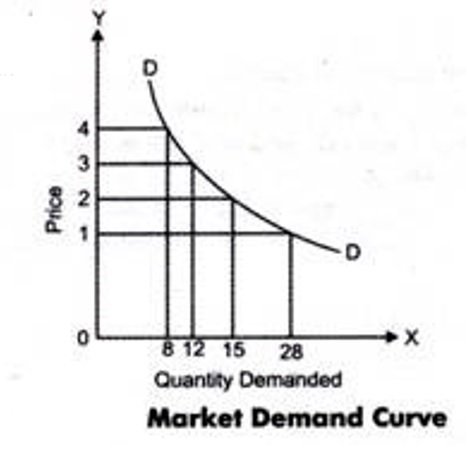
The market demand curve similarly represents an inverse relationship among the quantity demanded and price of a product.
Example of Market Demand Curve:
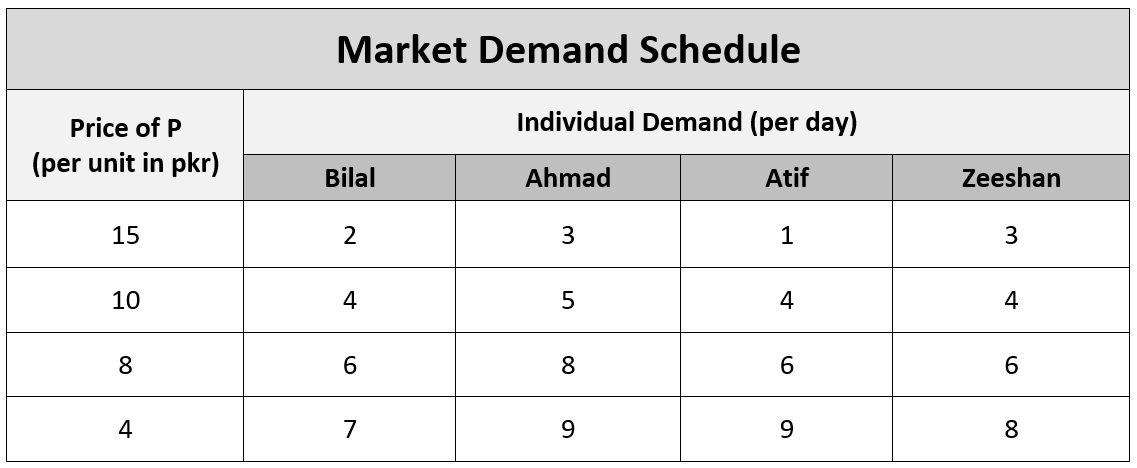
Example: Bilal, Ahmad, Atif, and Zeeshan are the four customers of product P. The individual demand schedules for product P by the four customers at various price levels is represented in the table below:
Requirement: Determine the market demand curve for product P and make a market demand curve for product P.
Solution:
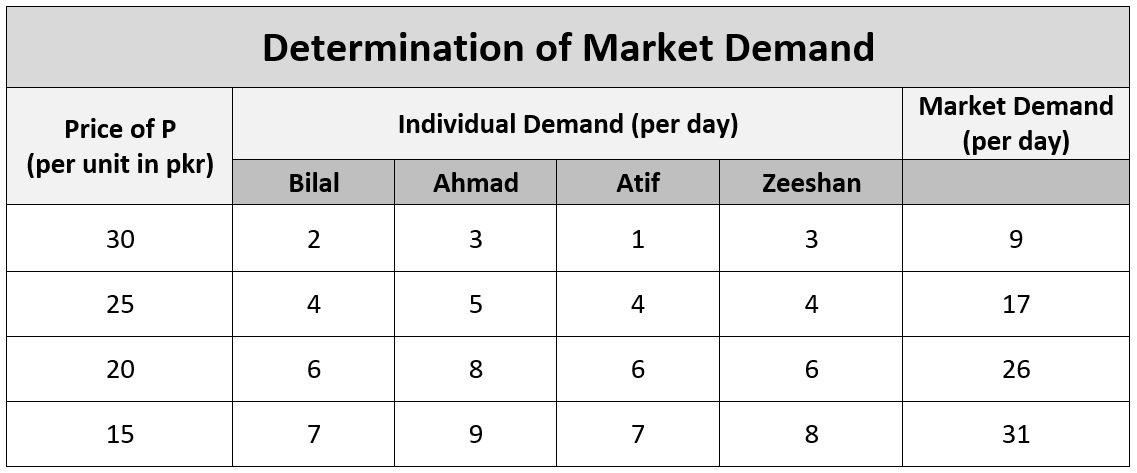
The market demand for product P can be found by adding the individual demand schedules, as shown in below table:
The market demand curve for product P is shown in the figure below:
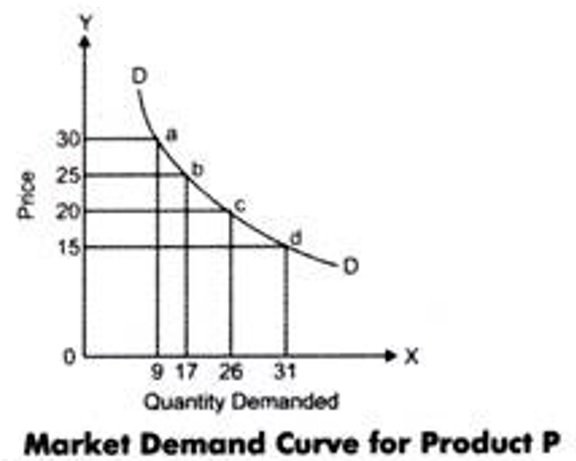
In this figure, the DD curve represents the demand curve for
product P.
February 20, 2017